Kenya Agricultural Market Price Analysis (2024–2026)

KSh0.00
Wishlist Compare

Description

An end-to-end Excel analytics project exploring how food prices behave across Kenyan counties — built from raw government data, cleaned by hand, and turned into an interactive dashboard with real, actionable findings


Product Features

  • Raw data extraction from KAMIS’s live market search tool (7 commodities × 11 counties)
  • Power Query ETL pipeline — combining, cleaning, and transforming ~10,800 raw price records
  • A proper star-schema data model in Excel’s Data Model (Power Pivot), not just a flat spreadsheet
  • DAX measures for volatility, margins, and data-quality checks
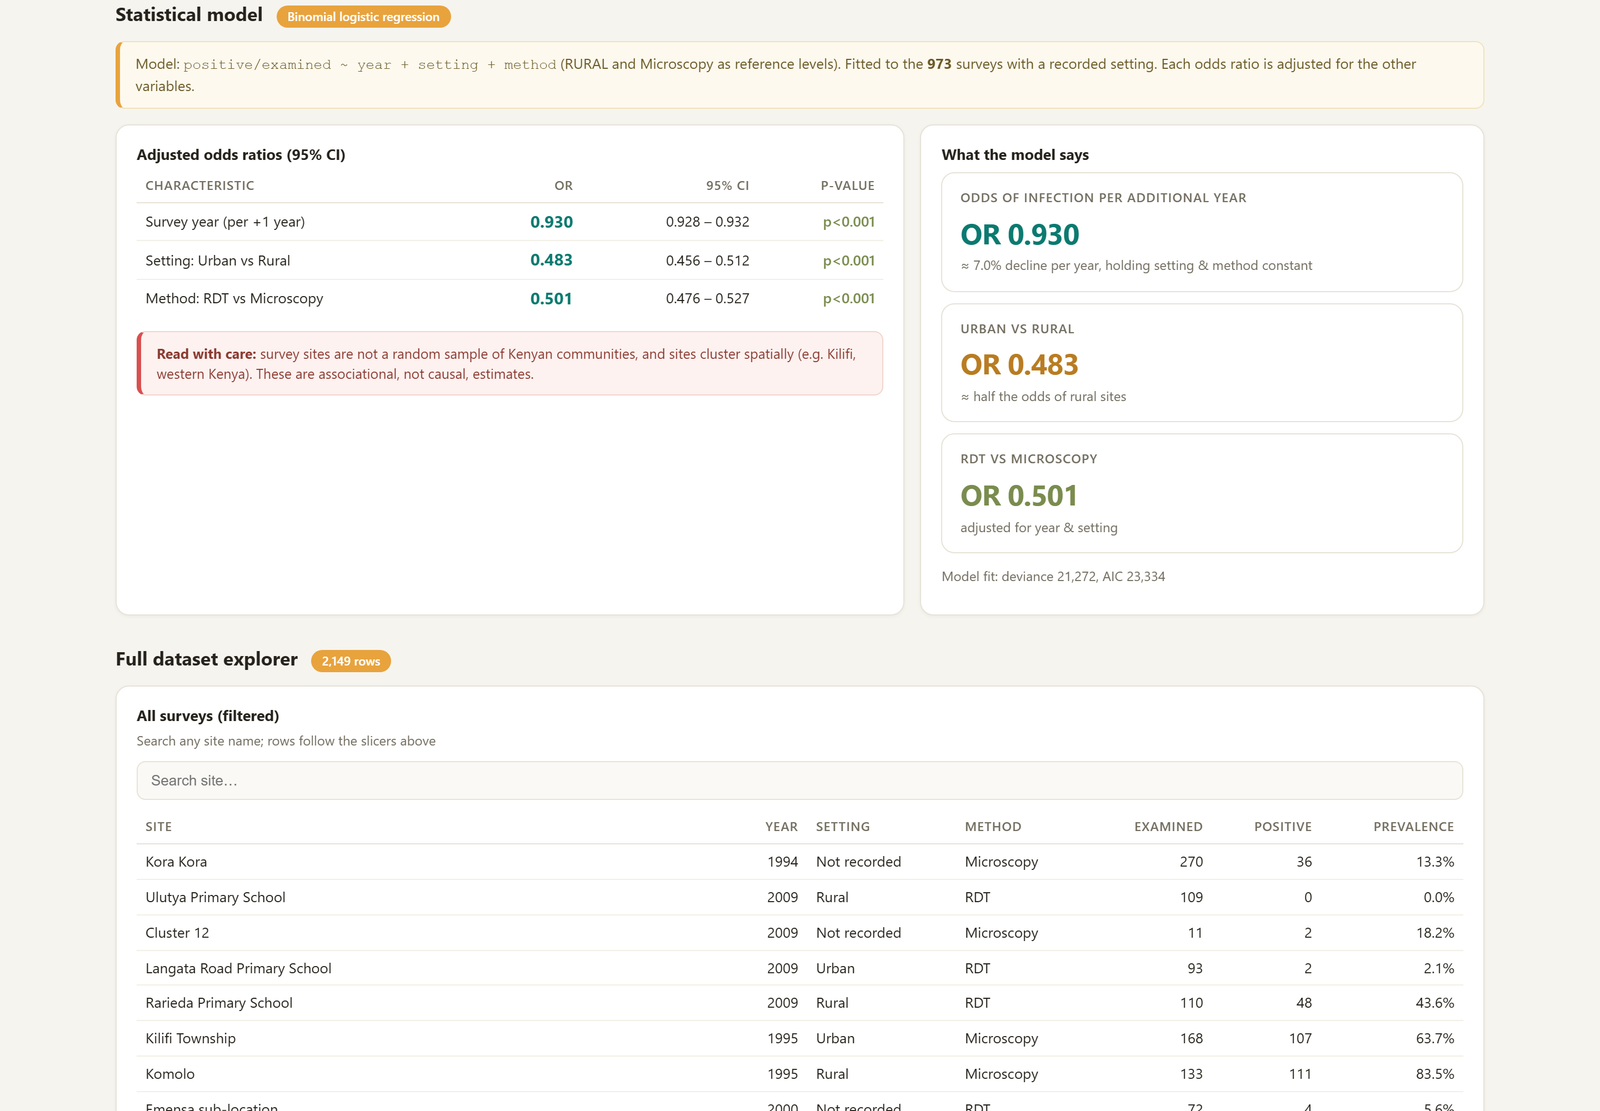
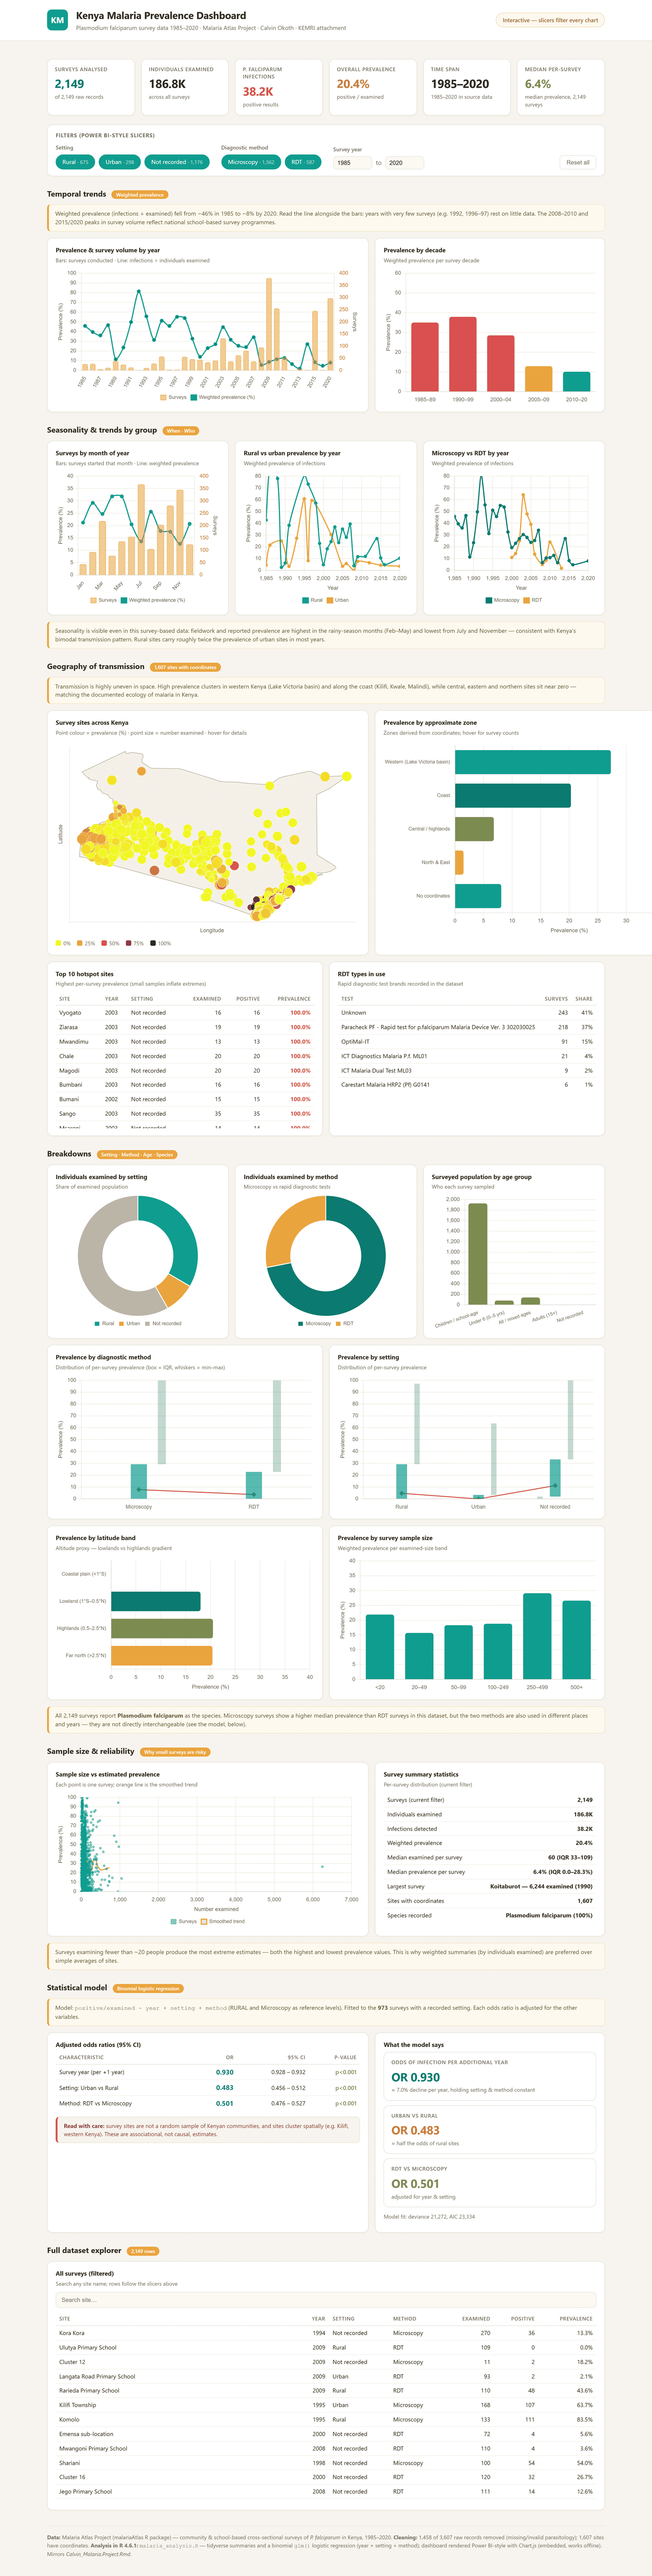
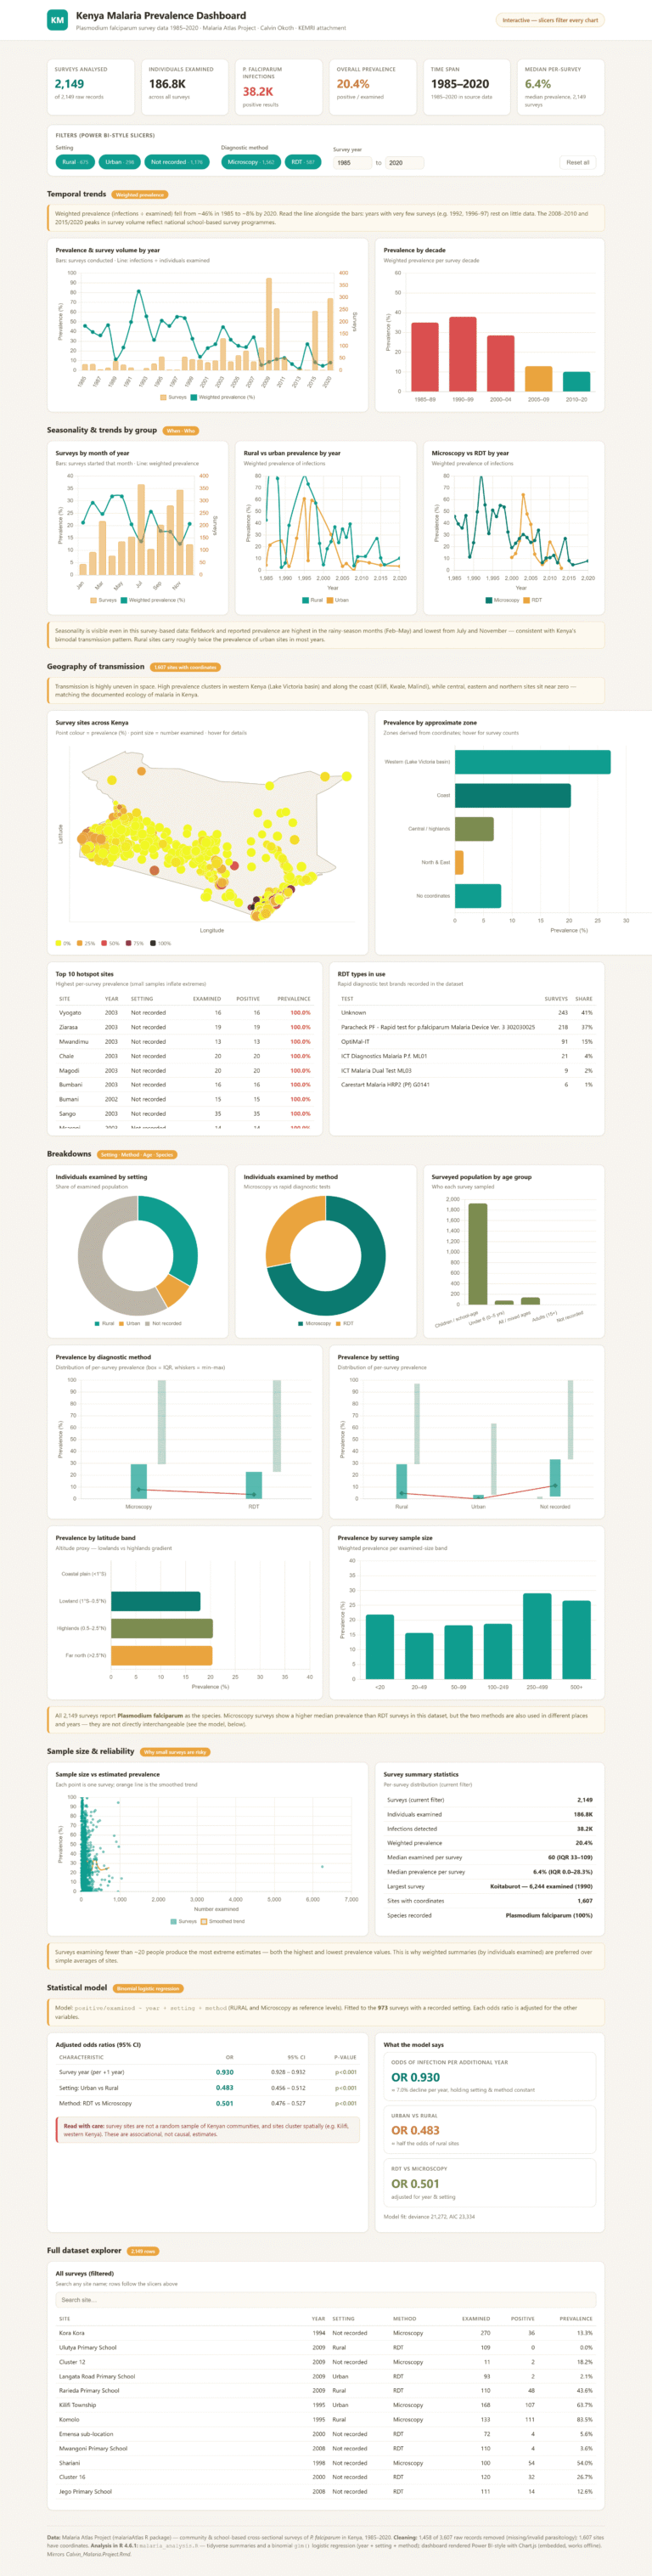
  • An interactive dashboard with slicers for County, Region, and Year
  • A full findings & recommendations report, written for both technical and non-technical readers


Real data doesn’t arrive clean, and this project leaned into that instead of hiding it. A few things I found and had to solve along the way:

  • Some counties simply weren’t in the system. I originally planned to cover Kiambu, Machakos, Mombasa, and Kajiado — but testing showed zero price records for any of them, across every commodity. Rather than force it, I swapped in better-covered counties and documented why.
  • One market was quietly broken. Molo (in Nakuru county) never once recorded a wholesale price, and its retail prices swung wildly with no coherent pattern. I traced it, confirmed it was a structural reporting issue rather than a one-off typo, and excluded it — with a clear note explaining why.
  • A few prices were off by a factor of 90. Some entries looked like someone had typed a price-per-90kg-bag into a price-per-kilogram field. I found these by comparing wholesale and retail prices against each other and flagging implausible ratios, not just eyeballing the data.
  • Small samples were quietly lying. A couple of county-commodity pairs looked “wildly volatile” — until I checked and found they only had 5 or 6 data points behind them. I added a minimum sample-size rule before trusting any volatility number.

None of this was hidden after the fact — every decision is logged in the report’s methodology section, including exactly how many rows were affected and why.


Loading...